Memory leaks are one of those bugs that are critical in nature and difficult to detect. Unlike a syntax error that breaks everything immediately, memory leaks gradually consume more and more RAM until your users start complaining about sluggish performance, frozen browsers, or crashes.
The frustrating part? Your app might work perfectly fine during development but become unusable after running for a few minutes in production.
I've dealt with my fair share of memory leaks over the years, and I can tell you that finding them doesn't have to be a nightmare. In this article I will walk through the process of detecting memory leaks using the browsers built-in dev tools.
What Are Memory Leaks in JavaScript?
Before we dive into detection, let's quickly understand what we're hunting for. A memory leak happens when your JavaScript code holds onto memory that it no longer needs.
Since JavaScript has automatic garbage collection, this usually occurs when you accidentally maintain references to objects that should be cleaned up.
The most common culprits are:
- Event listeners that aren't removed
- Timers that keep running
- Closures that capture large objects
- Detached DOM nodes
- Global variables that grow indefinitely
When I first bult the typing test on this website, I ran into an issue where the browser started to crash after repeated back to back tests. This took me a long time to debug and fix. The culprit?
I was storing each letter for the test into a global collection and I forgot to clear the contents after each test. The result was an increasingly growing array of DOM elements that eventually tanked the page.
And the browser dev tools can help us figure out if we have any of these issues.
Chrome DevTools has some incredibly powerful memory profiling tools. Here's how to use them effectively:
The Memory Tab
Open DevTools (F12) and navigate to the "Memory" tab. You'll see several profiling options:
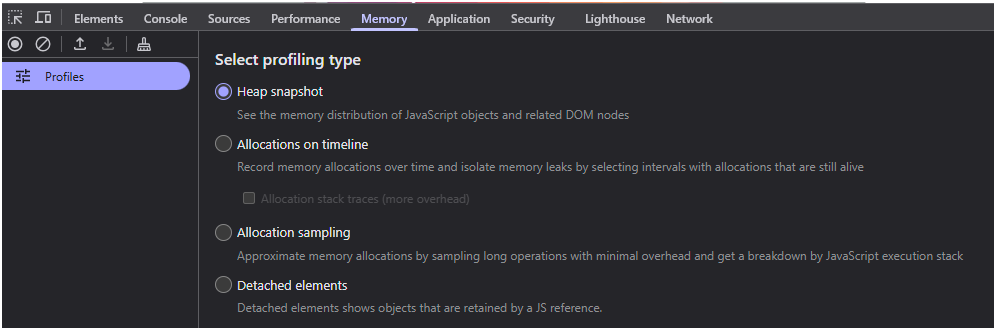
Heap Snapshot: Takes a picture of your memory usage at a specific moment
Allocation Timeline: Shows memory allocations over time
Allocation Sampling: Lighter-weight profiling for longer sessions
Taking Heap Snapshots
The heap snapshot is your go-to tool for memory leak detection. Here's my typical workflow:
- Take a baseline snapshot when your app first loads
- Use your application normally for a few minutes
- Take another snapshot after the activity
- Compare the snapshots to see what's growing
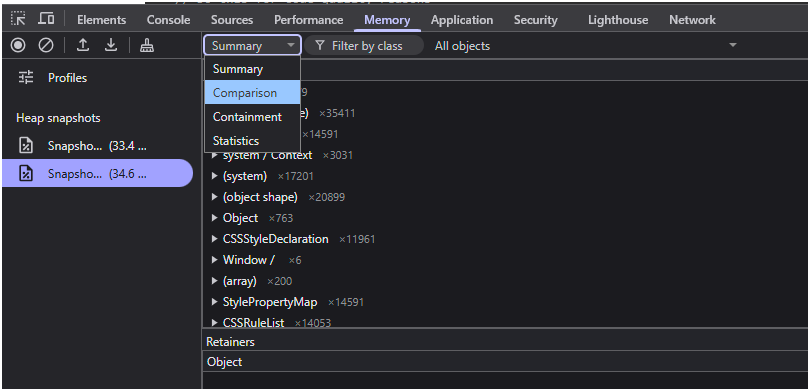
Look for objects that should have been garbage collected but are still hanging around. The "Comparison" view in DevTools will show you exactly what's been added between snapshots.
Reading the Results
When comparing snapshots, pay attention to:
- #New column: Shows newly created objects
- #Deleted column: Shows objects that were cleaned up
- #Delta column: Net change in object count
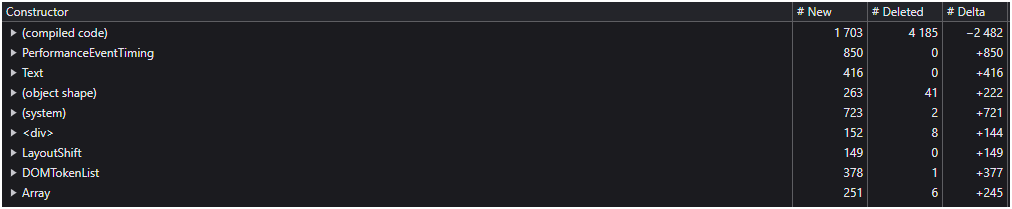
If you see large positive deltas for objects that should be temporary, you've likely found a leak.
The Three-Snapshot Technique
Here's a reliable method I use to confirm memory leaks:
- Baseline: Take a snapshot when the app loads
- Activity: Perform the action you suspect is leaking (open/close modals, navigate pages, etc.)
- Return: Go back to the initial state and take another snapshot
If objects from step 2 are still present in step 3, you've got a leak. The objects should have been cleaned up when you returned to the baseline state.
Common Memory Leak Patterns to Watch For
Event Listeners That Stick Around
// Bad: Event listener is never removed
function setupButton() {
  const button = document.getElementById('myButton');
  button.addEventListener('click', handleClick);
}

// Good: Clean up the listener
function setupButton() {
  const button = document.getElementById('myButton');
  const cleanup = () => button.removeEventListener('click', handleClick);
  button.addEventListener('click', handleClick);
  return cleanup;
}
Timers That Never Stop
// Bad: Timer keeps running forever
function startPolling() {
  setInterval(() => {
    fetchData();
  }, 1000);
}

// Good: Store reference and clean up
function startPolling() {
  const timerId = setInterval(() => {
    fetchData();
  }, 1000);

  return () => clearInterval(timerId);
}
Closures Capturing Large Objects
// Bad: Closure holds onto entire large object
function processData(largeDataset) {
  const summary = calculateSummary(largeDataset);

  return function() {
    // This closure captures the entire largeDataset
    // even though it only needs the summary
    return summary;
  };
}

// Good: Only capture what you need
function processData(largeDataset) {
  const summary = calculateSummary(largeDataset);

  return function() {
    return summary;
  };
}
The Performance tab in DevTools can also help identify memory issues:
- Start recording before performing the suspected action
- Perform the action (navigate, open modals, etc.)
- Stop recording and look at the memory graph
A healthy application should show memory usage going up and down as the garbage collector runs. If you see a steadily increasing line with no dips, that's a red flag.
Real-World Debugging Session
Let me walk you through a typical memory leak investigation:
Problem: Users report that a dashboard becomes slow after being open for several hours.
Investigation:
- Open the dashboard and take a baseline heap snapshot
- Let it run for 30 minutes with typical usage
- Take another snapshot and compare
Findings: The comparison shows thousands of new Event objects that should have been cleaned up.
Root Cause: The dashboard was adding event listeners every time data refreshed, but never removing the old ones.
Solution: Store listener references and clean them up before adding new ones.
Prevention is Better Than Detection
While knowing how to find memory leaks is crucial, preventing them is even better:
Use WeakMap and WeakSet
// Good: WeakMap doesn't prevent garbage collection
const userSessions = new WeakMap();

function trackUser(userObj) {
  userSessions.set(userObj, {
    loginTime: Date.now(),
    activity: []
  });
}
Clean Up in Lifecycle Methods
// React example
useEffect(() => {
  const handleResize = () => {
    // Handle resize
  };

  window.addEventListener('resize', handleResize);

  // Cleanup function
  return () => {
    window.removeEventListener('resize', handleResize);
  };
}, []);
Be Careful with Global Variables
// Bad: Global array that grows forever
window.userActions = [];

function logAction(action) {
  window.userActions.push(action);
}

// Good: Limited size with cleanup
const MAX_ACTIONS = 100;
window.userActions = [];

function logAction(action) {
  window.userActions.push(action);
  if (window.userActions.length > MAX_ACTIONS) {
    window.userActions.shift();
  }
}
When to Worry About Memory Leaks
Not every memory increase is a leak. Here's when you should investigate:
- Steady growth: Memory usage that increases over time without going down
- User complaints: Reports of slow performance after extended use
- Large increases: Sudden jumps in memory usage after specific actions
- Mobile issues: Performance problems on mobile devices (they have less memory)
The Bottom Line
Memory leaks can be frustrating to track down, but with the right approach, they're totally manageable. Use Chrome DevTools to take heap snapshots, compare memory usage over time, and identify objects that should have been cleaned up.
Remember that prevention is your best defense. Clean up event listeners, clear timers, and be mindful of what your closures capture. A little defensive coding goes a long way toward keeping your applications running smoothly.
Walt is a software engineer, startup founder and previous mentor for a coding bootcamp. He has been creating software for the past 20+ years.